<< 1주차 Lecture Note 1번째>>
- Value Chain of Data Analysis
- Dataset read with pandas
- Histogram and Bin size selection
Value Chain of Data Analysis
데이터 사이언스의 궁극적인 Goal은 데이터를 이해함으로써 가치를 창출하는 것이다.
- 패턴 인식을 통해 새로운 지식 도출 -> 새로운 서비스, 새로운 운영
- 실시간 분석 및 최적화 -> 업무 비용 및 시간 효율화
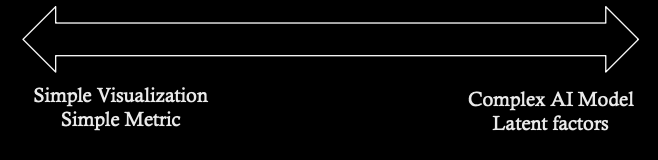
데이터를 이해하고 활용하는 레벨은 상황에 따라 달라질 수 있다.
- 아래 그림에서 보듯이 간단한 시각화, 지표화가 목표일 수 있고, 복잡한 모델링이 목표일 수도 있다.
강의에서 사용하는 데이터셋은 ucimlrepo의 'default of credit card clients' 데이터를 사용한다.
http://archive.ics.uci.edu/dataset/350/default+of+credit+card+clients
Dataset read with pandas
# Environment Setting
%reload_ext autoreload
%autoreload 2

import os
import sys
sys.path.append(os.path.dirname(os.path.dirname(os.getcwd())))
data_path = os.path.dirname(os.path.dirname(os.getcwd())) + '/data'

from ucimlrepo import fetch_ucirepo
default_of_credit_card_clients = fetch_ucirepo(id=350)

X = default_of_credit_card_clients.data.features
y = default_of_credit_card_clients.data.targets

col_dict = dict()
for row in default_of_credit_card_clients.variables[['name', 'description']].values:

    if row[1] == None:
        row[1] = 'id'

    if ' ' in row[1]:
        row[1] = row[1].replace(' ', '_')

    col_dict[row[0]] = row[1].lower()

import pandas as pd

raw_data = pd.concat([X, y], axis=1)
raw_data.rename(columns=col_dict, inplace=True)
raw_data.to_excel(f'{data_path}/credit_score.xlsx', index=False)DataScienceProgramming
├── coding
│ ├── columns.py
│ └── notebooks
├── data
│ └── credit_score.xlsx
└── lecture_note
Histogram and Bin size selection
데이터를 확인하는 가장 기본적인 방법은 분포를 알아보는 것이다.
분포를 어떻게 가정하냐에 따라 향후 분석 방향이나 방법론을 다르게 사용할 수 있기 때문이다.
분포를 알아보는 기초가 히스토그램을 그리는 것인데,
히스토그램의 X축인 bins 결정에 따라 분포가 다르게 보일 수 있다.

위 그림에서 4 또는 11개의 bins로 그린 히스토그램은 지수분포를 따르는 것으로 보인다.
하지만, 30 bins에서는 감마분포를 따르는 것으로 보인다.
bins 마다 분포 결정이 달라질텐데, 그 bins는 임의로 정하면 될까?
좀 더 체계적으로 구하는 방법이 있는데, 그 공식은 아래와 같다.
Square-root choice: \( k = \big \lceil \sqrt{n} \big \rceil \)
Sturge's formula: \( k = \sqrt{log_{2} n } + 1 \)
다음 프로젝트 투입 전까지 최대한 공부하자...
'KOOC > DataScience Programming' 카테고리의 다른 글
| Multivariate Gaussian Distribution and Covariance<4-1> (1) | 2024.05.19 |
|---|---|
| Confidence Interval and Bootstrapping <3-2> (0) | 2024.05.18 |
| Confidence Interval and Bootstrapping <3-1> (0) | 2024.05.14 |
| Distribution and Parameter Inference <2-1> (0) | 2024.05.13 |
| Data Handling and Descriptive Statistics <1-2> (0) | 2024.04.29 |


